Abstract
The tangible table paradigm is of great interest and utility to landscape architects, but their use is rare and often highly specialised. Here, we employ a cybernetics-informed perspective to analyse the 'input' and 'output' layers of this hybrid modelling mode and identify how it can become more flexible. These improvements informed the development of a piece of open-source software that integrates with contemporary augmented reality devices and established computational design methods. We present this integrative approach as essential to improving the accessibility and extensibility of tangible tables and to promoting their use as general-purpose 'tools for thought'.
Introduction
A landscape architect stands at a table in a dim room. Her hands push at a swathe of sand as she shapes the landform it portrays in miniature. A glowing set of rainbow hues and sinuous lines sit atop the white particles; rendering the character and contours of its form.
The 'tangible table' or 'augmented reality sandbox' modelling framework has been developed within landscape architecture and across an array of other fields. In its landscape architectural applications, the interaction paradigm of these tables has remained relatively consistent: users manipulate a sand, or sand-like, medium alongside a feedback loop that sees a computer digitise the physical model, apply analysis to the 3D model of landform, and project the resulting information back onto the physical media.
Tangible table implementations created outside of landscape architecture and the geospatial disciplines demonstrate a great variety of capture and display methods. However, this variety is rare in design-focused implementations rather than those used purely for teaching, exhibition, or other purposes1. Similarly, many landscape architectural applications also discard direct tangibility in favour of a focus on analogue simulations — such as those of hydraulic systems — as detailed in Cantrell & Holzman,2 Llabres & Rico,3 or Walliss & Rahmann.4 Others forgo hands-on manipulation in favour of more precise means of form-making, such as the robot arms recently demonstrated by Hurkxkens et al.5 and Fricker et al.6
These kinds of highly specialised applications are valuable for focused and contextual design development. On the other hand, the abrogation of direct user manipulation, and the highly customised nature of the table's hardware and software means that they have less value as general-purpose tools that can aid design development in an accessible and adaptive manner. This research aims to identify and develop a better middle-ground between the 'simple' and 'specialised' incarnations of a tangible table. To do so, we sought to create a table system — named 'Sandworm'7 — that foregrounds flexibility and incremental development in both its software and hardware interfaces.
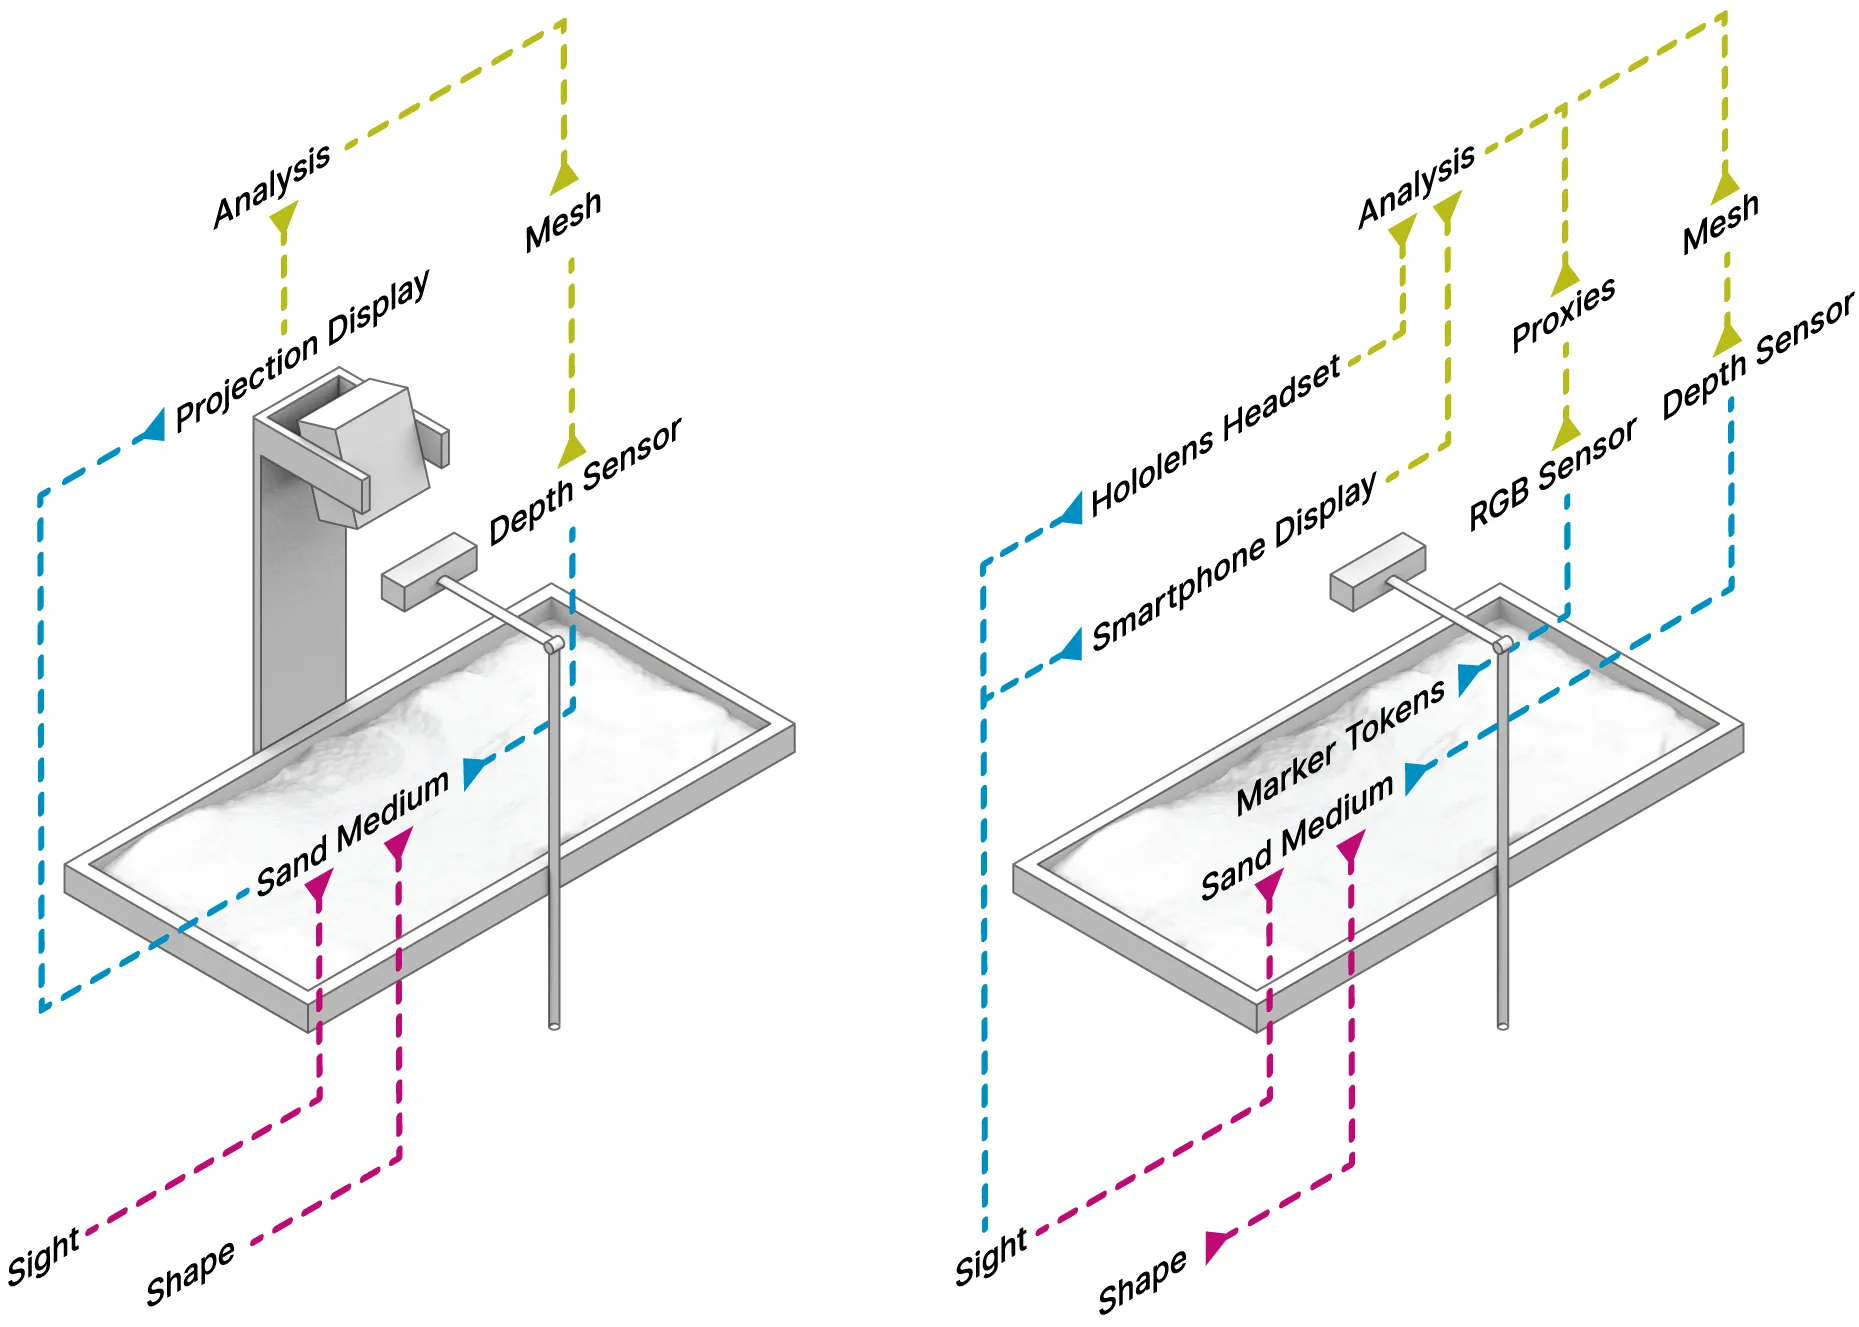
Figure .
Figure . Diagram of the system components that comprise a 'standard' tangible table setup (left) as compared to an setup that forgoes the projector in favour of an augmented reality display.
Approach and Analysis
Our investigation into tangible tables employed a framework drawn from cybernetics to analyse the different components that comprise a typical tangible table system. This perspective worked alongside a reflective practice method to interrogate the task of designing 'tools for designing tools' as per Fischer.8
Following a broadly second-order cybernetics framework, the analogue and digital components of a tangible table combine with a user's ongoing manipulation and observation to create a self-referential system.9 This model of interaction closely follows that of the design process itself — as per Glanville10 — in that it enables a circular process of experimentation that brings the designer into a 'conversation' with a particular medium. Unlike common computer-aided design (CAD) environments, a tangible table's media incorporates both digital procedures and a highly tactile means of embodied manipulation. The physicality of this manipulation helps address deficiencies found in a purely digital design environment, such as CAD's slowing of design ideation;11 the deficiencies of abstracted digital landform;12 or the distanced forms of collaboration available in most digital media.13
When seen as a circular system for designing landscapes, the key feedback loop of a tangible table consists of an 'input' layer, in the form of a pliant physical media, and an 'output' layer in the form of a projection superposed onto the table. While this hands-on model of interaction is highly intuitive and expressive, the design conversation it offers is typically bounded because each layer is overly fixed in its function. We began our development process by identifying the limitations of each layer and testing how users could begin to manipulate their functions. In doing so, we aimed to enable users to become toolmakers who could design the type of conversation that each tangible table offers rather than act only as tool-users who work within a sandbox's predefined parameters.
Augmenting Outputs
Most tangible table setups employ a digital projector to display information atop the sandbox media. This display method is core to the 'augmented reality' format of the table as it is the primary conduit by which users perceive the information provided by the table's digital system.14
A reliance on projection for the system's output limits both the conceptual and practical flexibility of a tangible table setup. While digital projectors are widely available, their use in a tangible table is less 'off the shelf' as their overhead position requires a mount capable of cantilevering a significant weight. This need for a rigid or ceiling-based mount also means the table's hardware has a limited capacity for portability and flexibility once fabricated or procured. Further, they also require a complex calibration process to mitigate the differences between the fields of view of 3D scanners, such as the Kinect, and those of digital projectors.
Augmented reality displays that are head-mounted, or run on hand-held devices, offer an alternative to the use of digital projectors. Here we demonstrate an integration with the Microsoft HoloLens — an untethered headset that overlays a transparent digital display atop a user's normal view. While this display method can limit collaboration (to the number of devices available), having a headset supplant the role of the projector does enable a much more portable and rapid setup. This makes it ideal for fieldwork and teaching scenarios.
Our integration makes use of the Fologram plugin for Grasshopper to locate geometry created in Rhinoceros/Grasshopper within a physical space and visualise this using the HoloLens' display. This system also allows for smartphone or tablet displays to act as augmented reality displays; providing a more accessible and portable alternative to headset-based hardware. See Jahn et al.15 for details of this system.
Figure .
Figure . Two pairs of tokens determine each end of a section line that is then intersected with the landform model. The display of the resulting section is extruded above the landform so that it can be more thoroughly perceived. The left-side image is from a HoloLens display and the right-side from a smartphone display.
Aside from removing the need for a fixed projection, the primary benefit of a headset-based augmented reality system is to expand the digital display of a tangible table into three dimensions. This opens up a much richer set of visualisations that are especially well-suited to landscape architectural design tasks that operate at sub-geographic scales. By displaying form outside of a planimetric format, designers can more comprehensively examine features, such as buildings or plants, that feature volumetric complexity and so benefit from being able to be viewed at a range of angles.
The ability to show information in three-dimensions also enables a less obvious, but equally valuable, application: the display of much richer forms of analytic overlay. Whereas two-dimensional projections have limited information density, three-dimensional data visualisations can use the z-axis to display additional information and to prevent overlapping layers of information from obscuring each other. This style of 'datascape' visualisation is particularly valuable when evaluating design features that are strongly volumetric, such as measuring cut/fill or deploying multiple types of data visualisation simultaneously, as shown in Figures 3-4.
Augmenting Inputs
Tangible table setups used in urban modelling often forgo the use of a sculptural medium, such as sand, as the key 'input' that users employ to manipulate the model.16 Instead, they may employ other forms of physical modelling, such as foam blocks.17 Regardless of the physical media used, the digitised model of a tangible table is typically of low fidelity and is only quasi-volumetric because the overhead position of the 3D scanner cannot capture shapes that are parallel to its line of sight. The use of more detailed physical models within a sandbox is thus limited — while users can perceive their details, the sensing system that forms the input layer of the table can only capture a very indistinct copy of the form.
Further, tangible tables typically have a limited ability to capture non-geometric characteristics because 3D-scanning systems process information as point-clouds comprised of XYZ coordinates and colour values. This data structure acts as a filter that excludes an easy consideration of materiality and composition; limiting the exploration of these issues within a design. For instance, different areas of landform may be imagined as having distinct surface materials, or planting schemes, but the sensing system of a tangible table cannot register this differentiation as its sensing only captures geometric form.
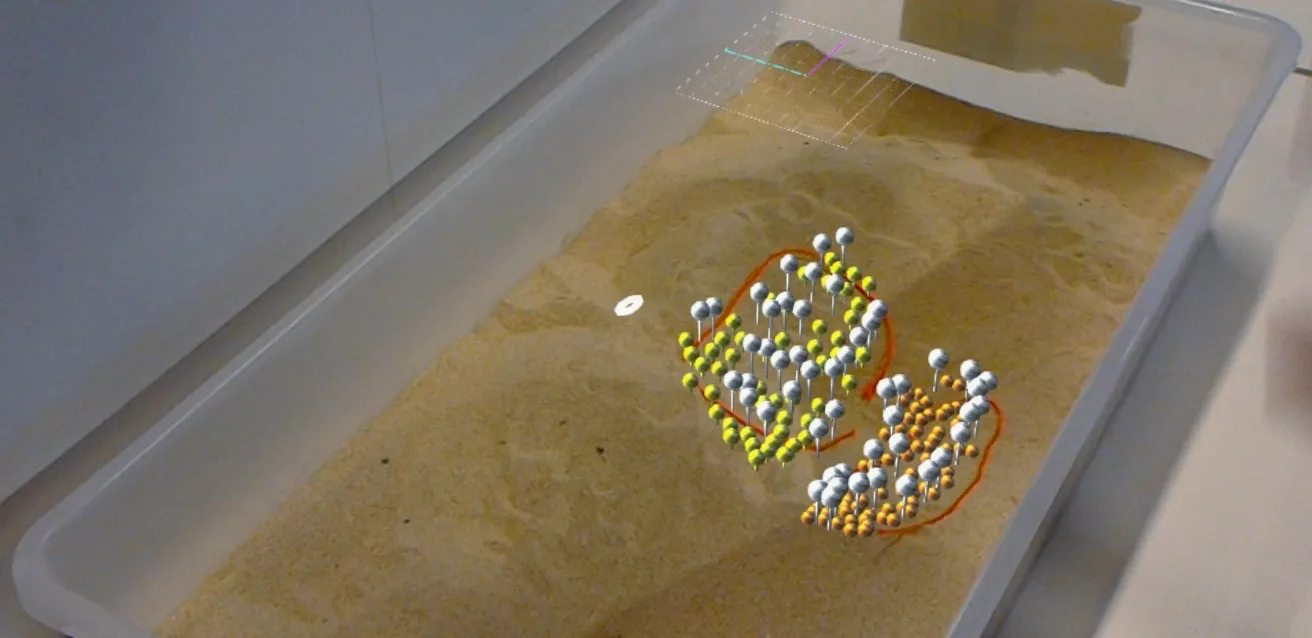
Some table systems work around these issues by allowing users to augment formal models with a system of symbolic tokens. These tokens are not physical models of a design feature, but rather indexing markers that are cross-referenced into a digital model, as demonstrated in Ishii et al.18 or Alonso et al.19 These markers then act as proxies for more complex features that are difficult to model or move physically, as demonstrated in Figures 3-4.
Figure .
Figure . Coloured string demarcates a distinct region within the landform. Each region is then populated with a different parametrically-controlled population of plants and their basic geometry visualised atop the landform.
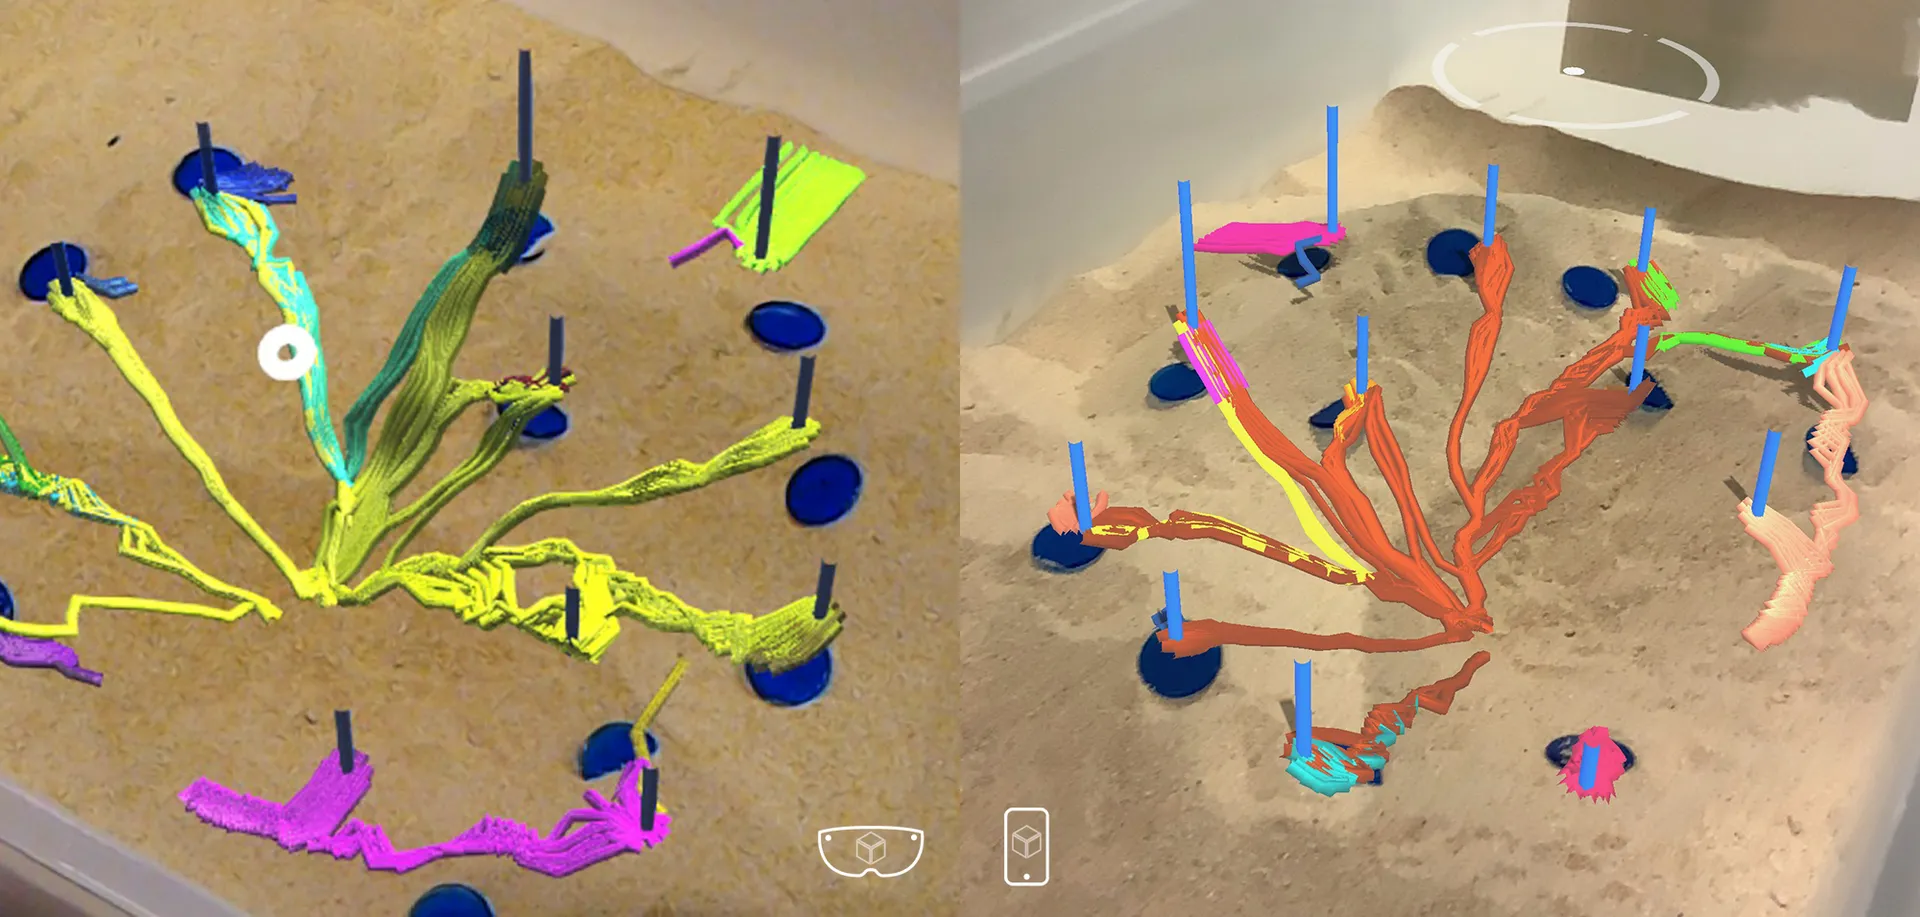
Figure .
Figure . Tokens placed on the landform act as the starting points for a simulation of surface water flow across the landform. Each flow-path's colour visualises the proximity of their end-points in order to illustrate distinct catchment areas.
When incorporating tokens into a tangible table system, the proxy relationship between the marker and what it represents is typically predetermined and difficult to alter — either because the system's source code is unavailable; because users lack the expertise to edit this code; or because the system's graphical interfaces have limited affordances for in-depth customisation. For instance, the Tangible Landscape system provides an extensive set of features for tracking and configuring markers. However, because these features are configured using Python scripts,20 they present a barrier to users who are not well-versed in the programming languages and frameworks that underpin geospatial tools.
To address these limitations, we added a series of features to track the location of physical markers using established computer vision techniques that isolate distinct colours and shapes within Kinect's video feed. Crucially, because we implemented our tangible table system within the Grasshopper environment, these new features act as bridges that allow users to easily define the proxy relationships that determine exactly what each marker represents. A Grasshopper-based implementation also enables users to easily tie the geometric outputs of the tokens to downstream simulation or analysis using standard geometric parameters. For instance, a string-based token might be used to define a perimeter around a particular region, which our machine-vision analysis would then translate into a standard Polycurve that could be parametrically in-filled with a particular planting scheme or used to define a surface's permeability as part of an infiltration analysis. In a similar fashion, small circular markers of different colours can be translated into XYZ coordinates that then locate physical design features — e.g. outflow pipes or pavilions — as well as analysis parameters — e.g. key viewpoints or water sources.
These capabilities significantly enhance the value of a tangible table system as they provide an approachable, yet flexible, means of modelling design features that are not expressed solely through landform. This extensibility comes from the flexible nature of Grasshopper itself, as well as the wealth of community-created plugins available within it.21
Discussion and Conclusion
Taken together, the ability to display 3-dimensional information and the ability to define flexible proxy relationships, allows tangible tables to model a much broader range of landscape architectural design features. These enhancements to the input and output layers of the system afford users new capabilities, but also new levels of control over how the system operates without necessitating textual programming.
This focus on flexibility and adaptability is the ultimate aim of this project, rather than any of the particular case studies or workflows we've provided in illustration. It also dictates why, for now, we have stuck to established techniques — such as machine vision and augmented reality — that other tangible table setups have also demonstrated. If these established techniques can be packaged within a sufficiently open and extensible framework, as shown in Figure 5, tangible modelling can — like Grasshopper itself — afford users greater agency over their digital design tools. This, in turn, means that the composition and operations of a sandbox can better match the needs of a given design process and design goal on an ad-hoc basis.
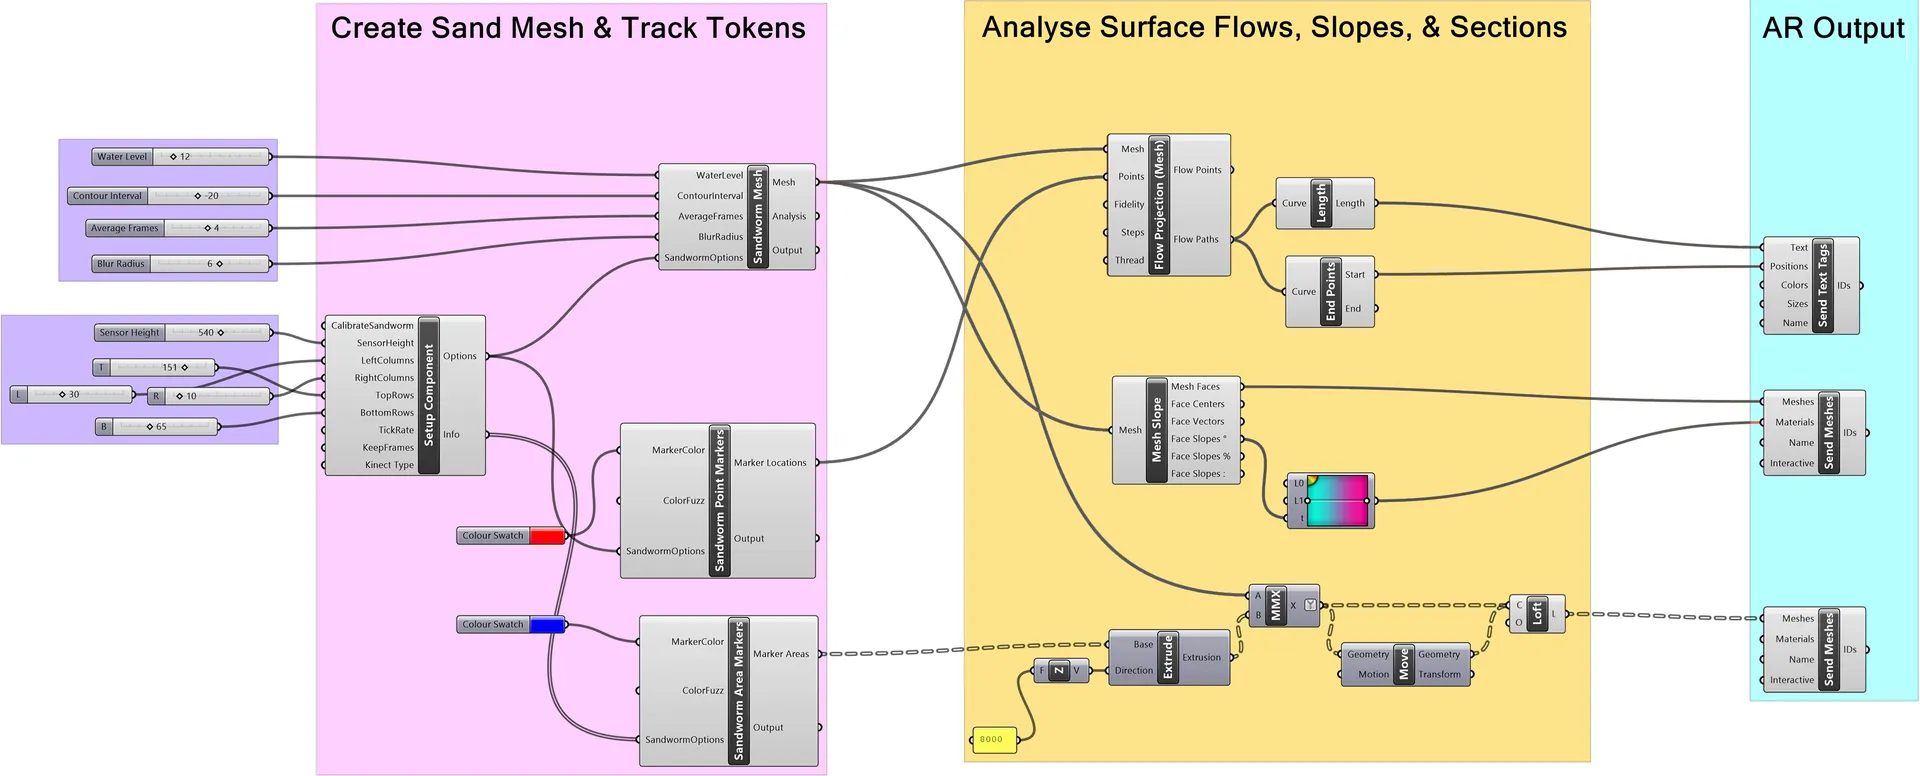
Figure .
Figure . An example of a Grasshopper definition that employs the new Tangible Table components (pink) to digitise the landform and track marker components. Further components are used to analyse these parameters (yellow) before Fologram is used to visualise the results (teal). The quantity of components and complexity of connections is low; demonstrating a modular and accessible setup that accepts multiple types of input data and outputs multiple types of visualisation.
In foregrounding approachability over novelty, we echo a call that is increasingly common across the broader use of computational techniques in the built environment disciplines. While design automation is commonly employed to resolve discrete design problems, its use is often limited by the gap between a tool's use and its usability; by its lack of flexibility; and by the gap between a technical model and the designer's conceptual model.22 These problems can be, in part, addressed by providing users greater agency — allowing them to act more like the toolmakers that define the interfaces, trade-offs, and tendencies of a particular tool. Advances in user control would then act in a complementary fashion to future advances in tangible sensing and visualisation, such as those imagined in Ulmer et al.23
Enabling a process of tool-design becomes particularly potent in the case of tangible modelling. Computational design environments, such as Grasshopper, require users to understand their design goals in highly abstracted terms because they are represented as the results of logical procedures encapsulated within various components and parameters. This often means that the process of modifying a design is unintuitive — even small changes to the dimensions or location of design features requires unpacking exactly where those elements are defined within the data-flow of the visual script. The nature of tangible tables can help to address many of these concerns, as they maintain an intuitive haptic interface that anchor otherwise-abstract models in a tactile mode of manipulation. Earlier versions of tangible tables have demonstrated their benefits for design iteration and design understanding, particularly when examining a number of landscape-centric phenomena, such as hydrological systems, that have close ties to landform. However, tangible tables have rarely allowed a broad base of users to define the terms of these interactions within a broader computational design framework.
The task of augmenting the tangible table paradigm works within a broader effort to develop tools that better model landscape architectural knowledge and technique. This endeavour has a long history within our own discipline, and mirrors emerging human-computer interaction research that seeks to develop "tools for thought"24 that actively aid, rather than merely facilitate, creative exploration in a particular domain. This vision of seamlessly slipping between tool-use and tool-making reveals computer-aided design as developed on landscape architecture's own terms, rather than through the appropriation of other discipline's methods. For tangible tables to realise this goal, their digital media need to become more like their physical media: flexible and accessible.
Footnotes
Petrasova, Anna, Vaclav Petras, Payam Tabrizian, and Helena Mitasova. Tangible Modeling with Open Source GIS. New York, NY: Springer International Publishing, 2018. ↩
Cantrell, Bradley, and Justine Holzman. 'Synthetic Ecologies'. In Proceedings of the 34th Annual Conference of the Association for Computer Aided Design in Architecture. Los Angeles, CA: ACADIA, 2014. ↩
Llabres, Enriqueta, and Eduardo Rico. 'Proxi Modelling: A Tacit Approach to Territorial Praxis'. The Journal of Space Syntax 5, no. 1 (2014): 50–67. ↩
Walliss, Jillian, and Heike Rahmann. Landscape Architecture and Digital Technologies. Abingdon, England: Routledge, 2016. ↩
Hurkxkens, Ilmar, Ammar Mirjan, Fabio Gramazio, Mathias Kohler, and Christophe Girot. 'Robotic Landscapes: Designing Formation Processes for Large Scale Autonomous Earth Moving'. In Impact: Design With All Senses, edited by Christoph Gengnagel, Olivier Baverel, Jane Burry, Mette Ramsgaard Thomsen, and Stefan Weinzierl, 69–81. Springer International Publishing, 2020. ↩
Fricker, Pia, Toni Kotnik, and Luka Piskorec. 'Structuralism: Patterns of Interaction Computational Design Thinking across Scales'. Journal of Digital Landscape Architecture 2019, no. 4 (21 May 2019): 239–47. ↩
For a more general introduction to Sandworm, see: Hermansdorfer, Mariusz, Hans Skov-Petersen, Pia Fricker, Kane Borg, and Philip Belesky. 'Bridging Tangible and Virtual Realities - Computational Procedures for Data-Informed Participatory Processes'. Journal of Digital Landscape Architecture 5 (3 June 2020): 354–65. https://doi.org/10.14627/537690036. ↩
Fischer, Thomas. 'Designing (Tools (for Designing (Tools (For ...))))'. Doctoral Thesis, RMIT University, 2008. ↩
Pask, Gordon. 'The Architectural Relevance of Cybernetics'. Architectural Design 39 no. 9 (1969): 494–96. ↩
Glanville, Ranulph. 'Researching Design and Designing Research'. Design Issues 15, no. 2 (1999): 80–91. ↩
Barbarash, David. 'Representation Stigma'. Frontiers of Architectural Research 5, no. 4 (2016): 477–88. ↩
Ervin, Stephen M. 'Digital Landscape Modeling and Visualization: A Research Agenda'. Our Visual Landscape: Analysis, Modeling, Visualization and Protection 54, no. 1 (2001): 49–62. ↩
Salim, Flora, and Przemek Jaworski. 'Exploring Human-Computer Interaction in Design Process'. In Inside Smartgeometry, 166–75. John Wiley & Sons, Ltd, 2014. ↩
Harmon, Brendan A, Anna Petrasova, Vaclav Petras, Helena Mitasova, and Ross Meentemeyer. 'Tangible Topographic Modeling for Landscape Architects'. International Journal of Architectural Computing 16, no. 1 (2018): 4–21. ↩
Jahn, Gwyllim, Cameron Newnham, Nick van den Berg, Melissa Iraheta, and Jackson Wells. 'Holographic Construction'. In Impact: Design with All Senses, edited by Christoph Gengnagel, Olivier Baverel, Jane Burry, Mette Ramsgaard Thomsen, and Stefan Weinzierl, 314–24. Cham: Springer International Publishing, 2020. ↩
Petrasova, Anna, Vaclav Petras, Payam Tabrizian, and Helena Mitasova. Tangible Modeling with Open Source GIS. New York, NY: Springer International Publishing, 2018. ↩
Salim, Flora. 'Tangible 3D Urban Simulation Table'. In Proceedings of the Symposium on Simulation for Architecture & Urban Design, 23:1-23:4. SimAUD '14. San Diego, CA, USA: Society for Computer Simulation International, 2014. ↩
Ishii, Hiroshi, Eran Ben-Joseph, John Underkoffler, Luke Yeung, Dan Chak, Zahra Kanji, and Ben Piper. 'Augmented Urban Planning Workbench: Overlaying Drawings, Physical Models and Digital Simulation'. In Proceedings of the 1st International Symposium on Mixed and Augmented Reality, 203, 2002. ↩
Alonso, Luis, Yan Ryan Zhang, Arnaud Grignard, Ariel Noyman, Yasushi Sakai, Markus ElKatsha, Ronan Doorley, and Kent Larson. 'CityScope: A Data-Driven Interactive Simulation Tool for Urban Design. Use Case Volpe'. In Unifying Themes in Complex Systems IX, edited by Alfredo J. Morales, Carlos Gershenson, Dan Braha, Ali A. Minai, and Yaneer Bar-Yam, 253–61. Cham: Springer International Publishing, 2018. ↩
Petrasova, Anna, Vaclav Petras, Payam Tabrizian, and Helena Mitasova. Tangible Modeling with Open Source GIS. New York, NY: Springer International Publishing, 2018. ↩
Davis, Daniel, and Brady Peters. 'Design Ecosystems: Customising the Architectural Design Environment with Software Plug-Ins'. Architectural Design 83, no. 2 (2013): 124–31. ↩
Heumann, Andrew, and Daniel Davis. 'Humanizing Architectural Automation: A Case Study in Office Layouts'. In Impact: Design With All Senses, edited by Christoph Gengnagel, Olivier Baverel, Jane Burry, Mette Ramsgaard Thomsen, and Stefan Weinzierl, 662–70. Springer International Publishing, 2020. ↩
Ullmer, Brygg, Philip Paar, Liviu Coconu, Jing Lyu, Miriam Konkel, and Hans-Christian Hege. 'An 1834 Mediterranean Garden in Berlin: Engaged from 2004, 2018, 2032, and 2202'. In Proceedings of the 7th ACM International Symposium on Pervasive Displays. PerDis '18. New York, NY, USA: Association for Computing Machinery, 2018. ↩
Matuschak, Andy, and Michael Nielsen. 'How Can We Develop Transformative Tools for Thought?' Numinous Productions, 10 January 2019. https://numinous.productions/ttft/. ↩